How to monitor your website (and webserver) for free
The Problem
Downtime is inevitable! But that doesn't mean you should not prepare for it. Yesterday for example, the network card in my firewall just died. Since I host my website at home, it was no longer accessible, and as a bonus the kids were all over me about their internet connection. Also our remote working capabilities went up in smoke. Long story short, fortunately I had another NIC that I bought for my server and one (long) hour later everything was like nothing happened.
Why a one-hour downtime for a hardware switch that took 2 minutes?
Well, finding what's wrong took a bit of time. Afterward, changing the network card means that the MAC address changes, so the associated IP addresses are no longer the same on the gateway. Then I had to reassign the network interfaces in pfsense (plug in a monitor and a keyboard). So it was a good exercise in staying calm and working fast. For those of you who have "working under pressure" in your resumes, this was it!
The Solution (complicated, expert mode on)
Searching for a good monitoring tool, that also has a free plan, is not an easy task. There's a lot to set up and configure so you have to be sure that in the end it's not just for a 14 days trial, but something you can use for as long as you like. If it's a solution that enables you to expand along the way as you upgrade your network that's the cherry on top. Enter Datadog.
Datadog’s solution is compliant with all data protection laws and regulations applicable to the services they provide and is compliant with the General Data Protection Regulation (GDPR) as of May 25, 2018. (source)
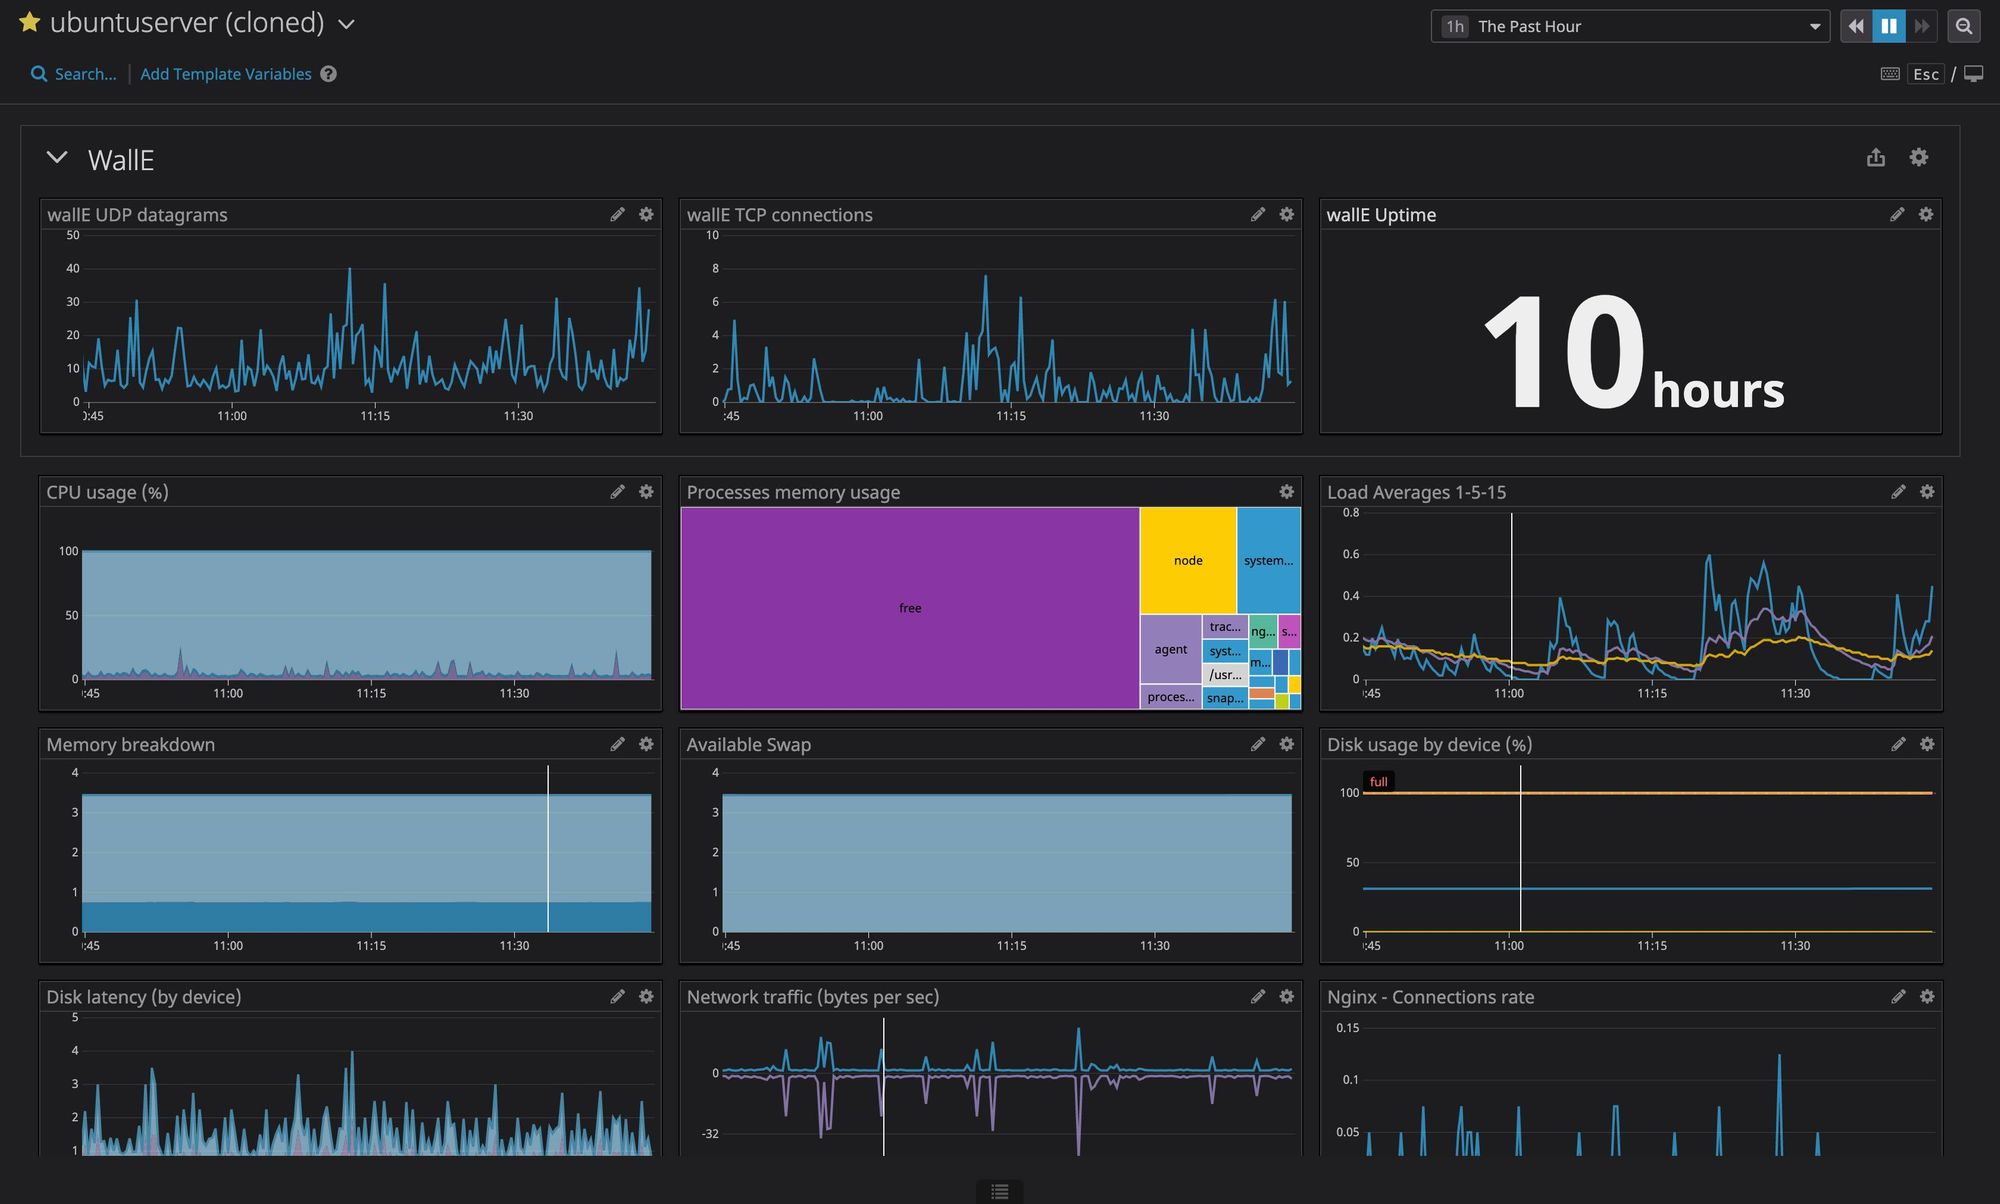
So it's GDPR compliant. Even better, since I'm living in Europe I'm concerned about it. A few minutes later I have cleaned my headers of all the Google and Facebook analytics scripts and added the one provided by Datadog. I also installed the agent on the server, and added NGINX integration, along with SNMP. The last one allows me to get the data from the pfsense firewall. This way I have everything collected and presented in one nice-looking dashboard. If you want even more data, check out the tutorial written by James Tenniswood on Monitoring Unifi devices using SNMP and Datadog. Here's my end result:
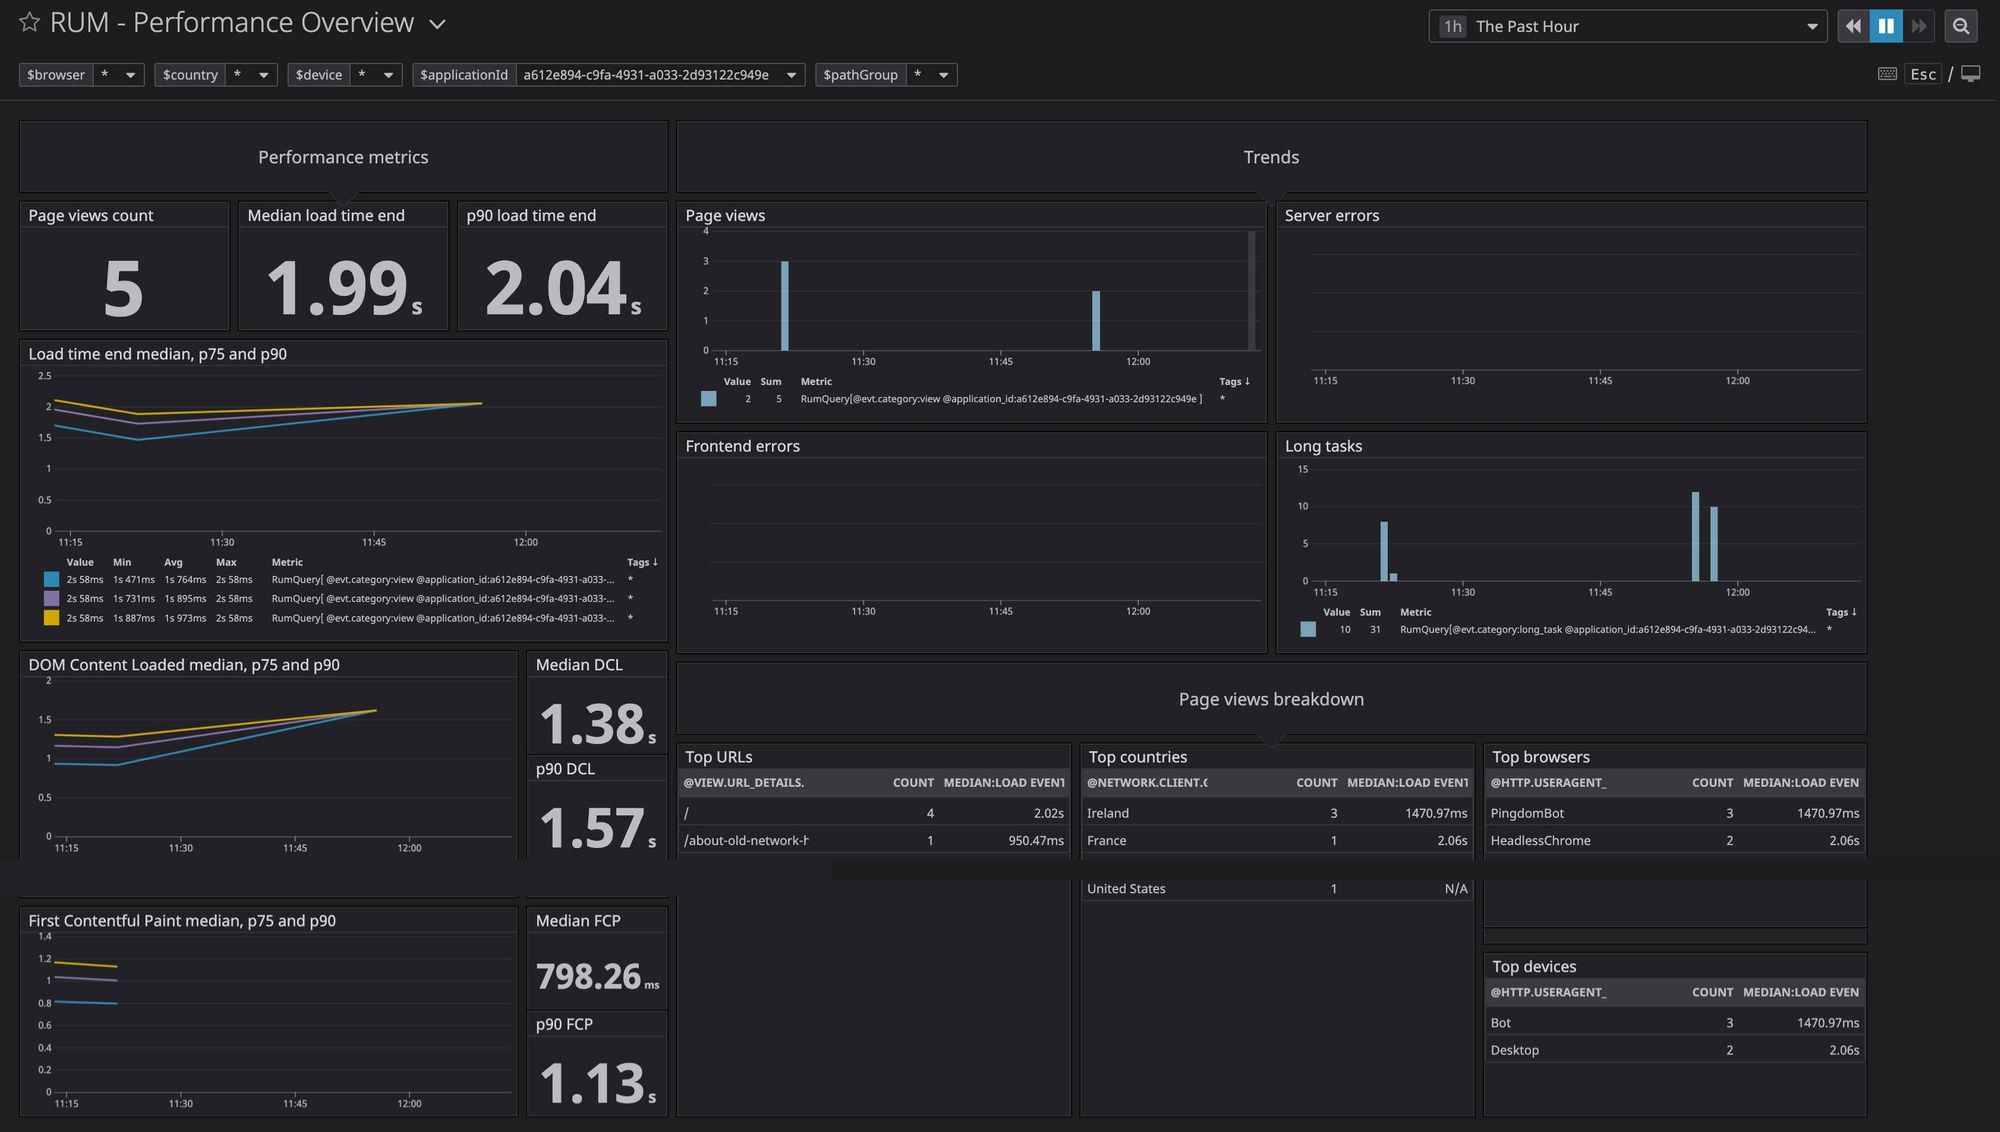
Now let's dive further, since this is monitoring the backend, let's do something about the website. Easy, since Datadog provides a way to do this named UX Monitoring. For the RUM (Real User Monitoring) you will have to add a script in your website header (GDPR remember?). Once the data lands on the Datadog server you are presented with the following dashboard:
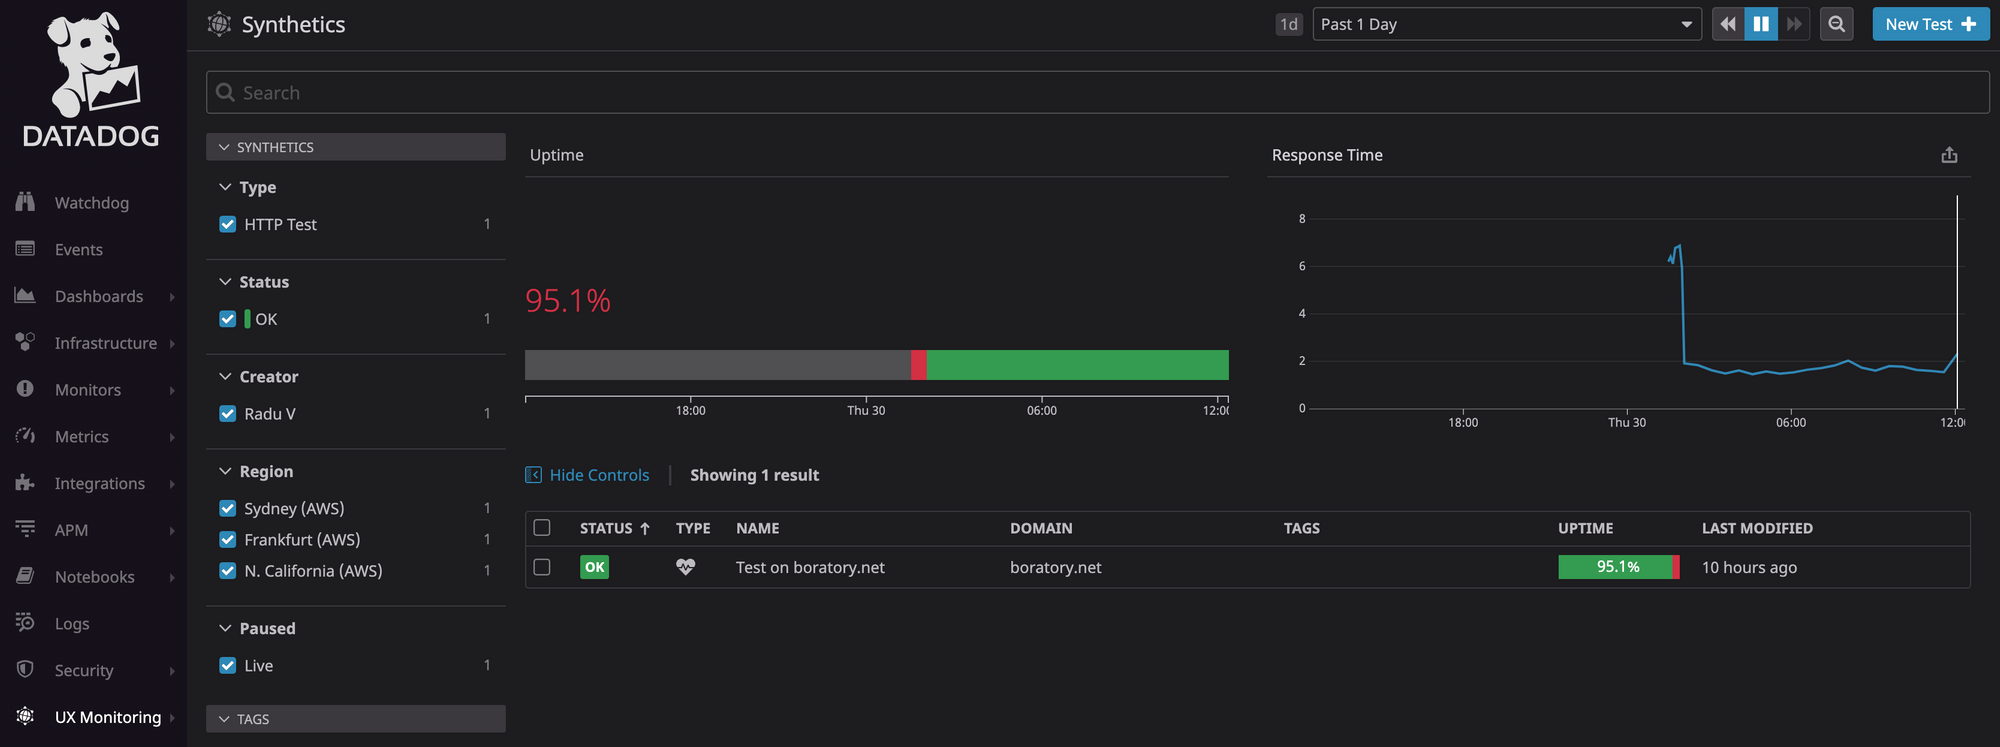
And now the monitoring part. Datadog has a lot of AWS sites all over the world that will be used to hit your website. This way you can check your response times from different regions of the world, from the US to Australia.
You can configure every detail of the test, of course.
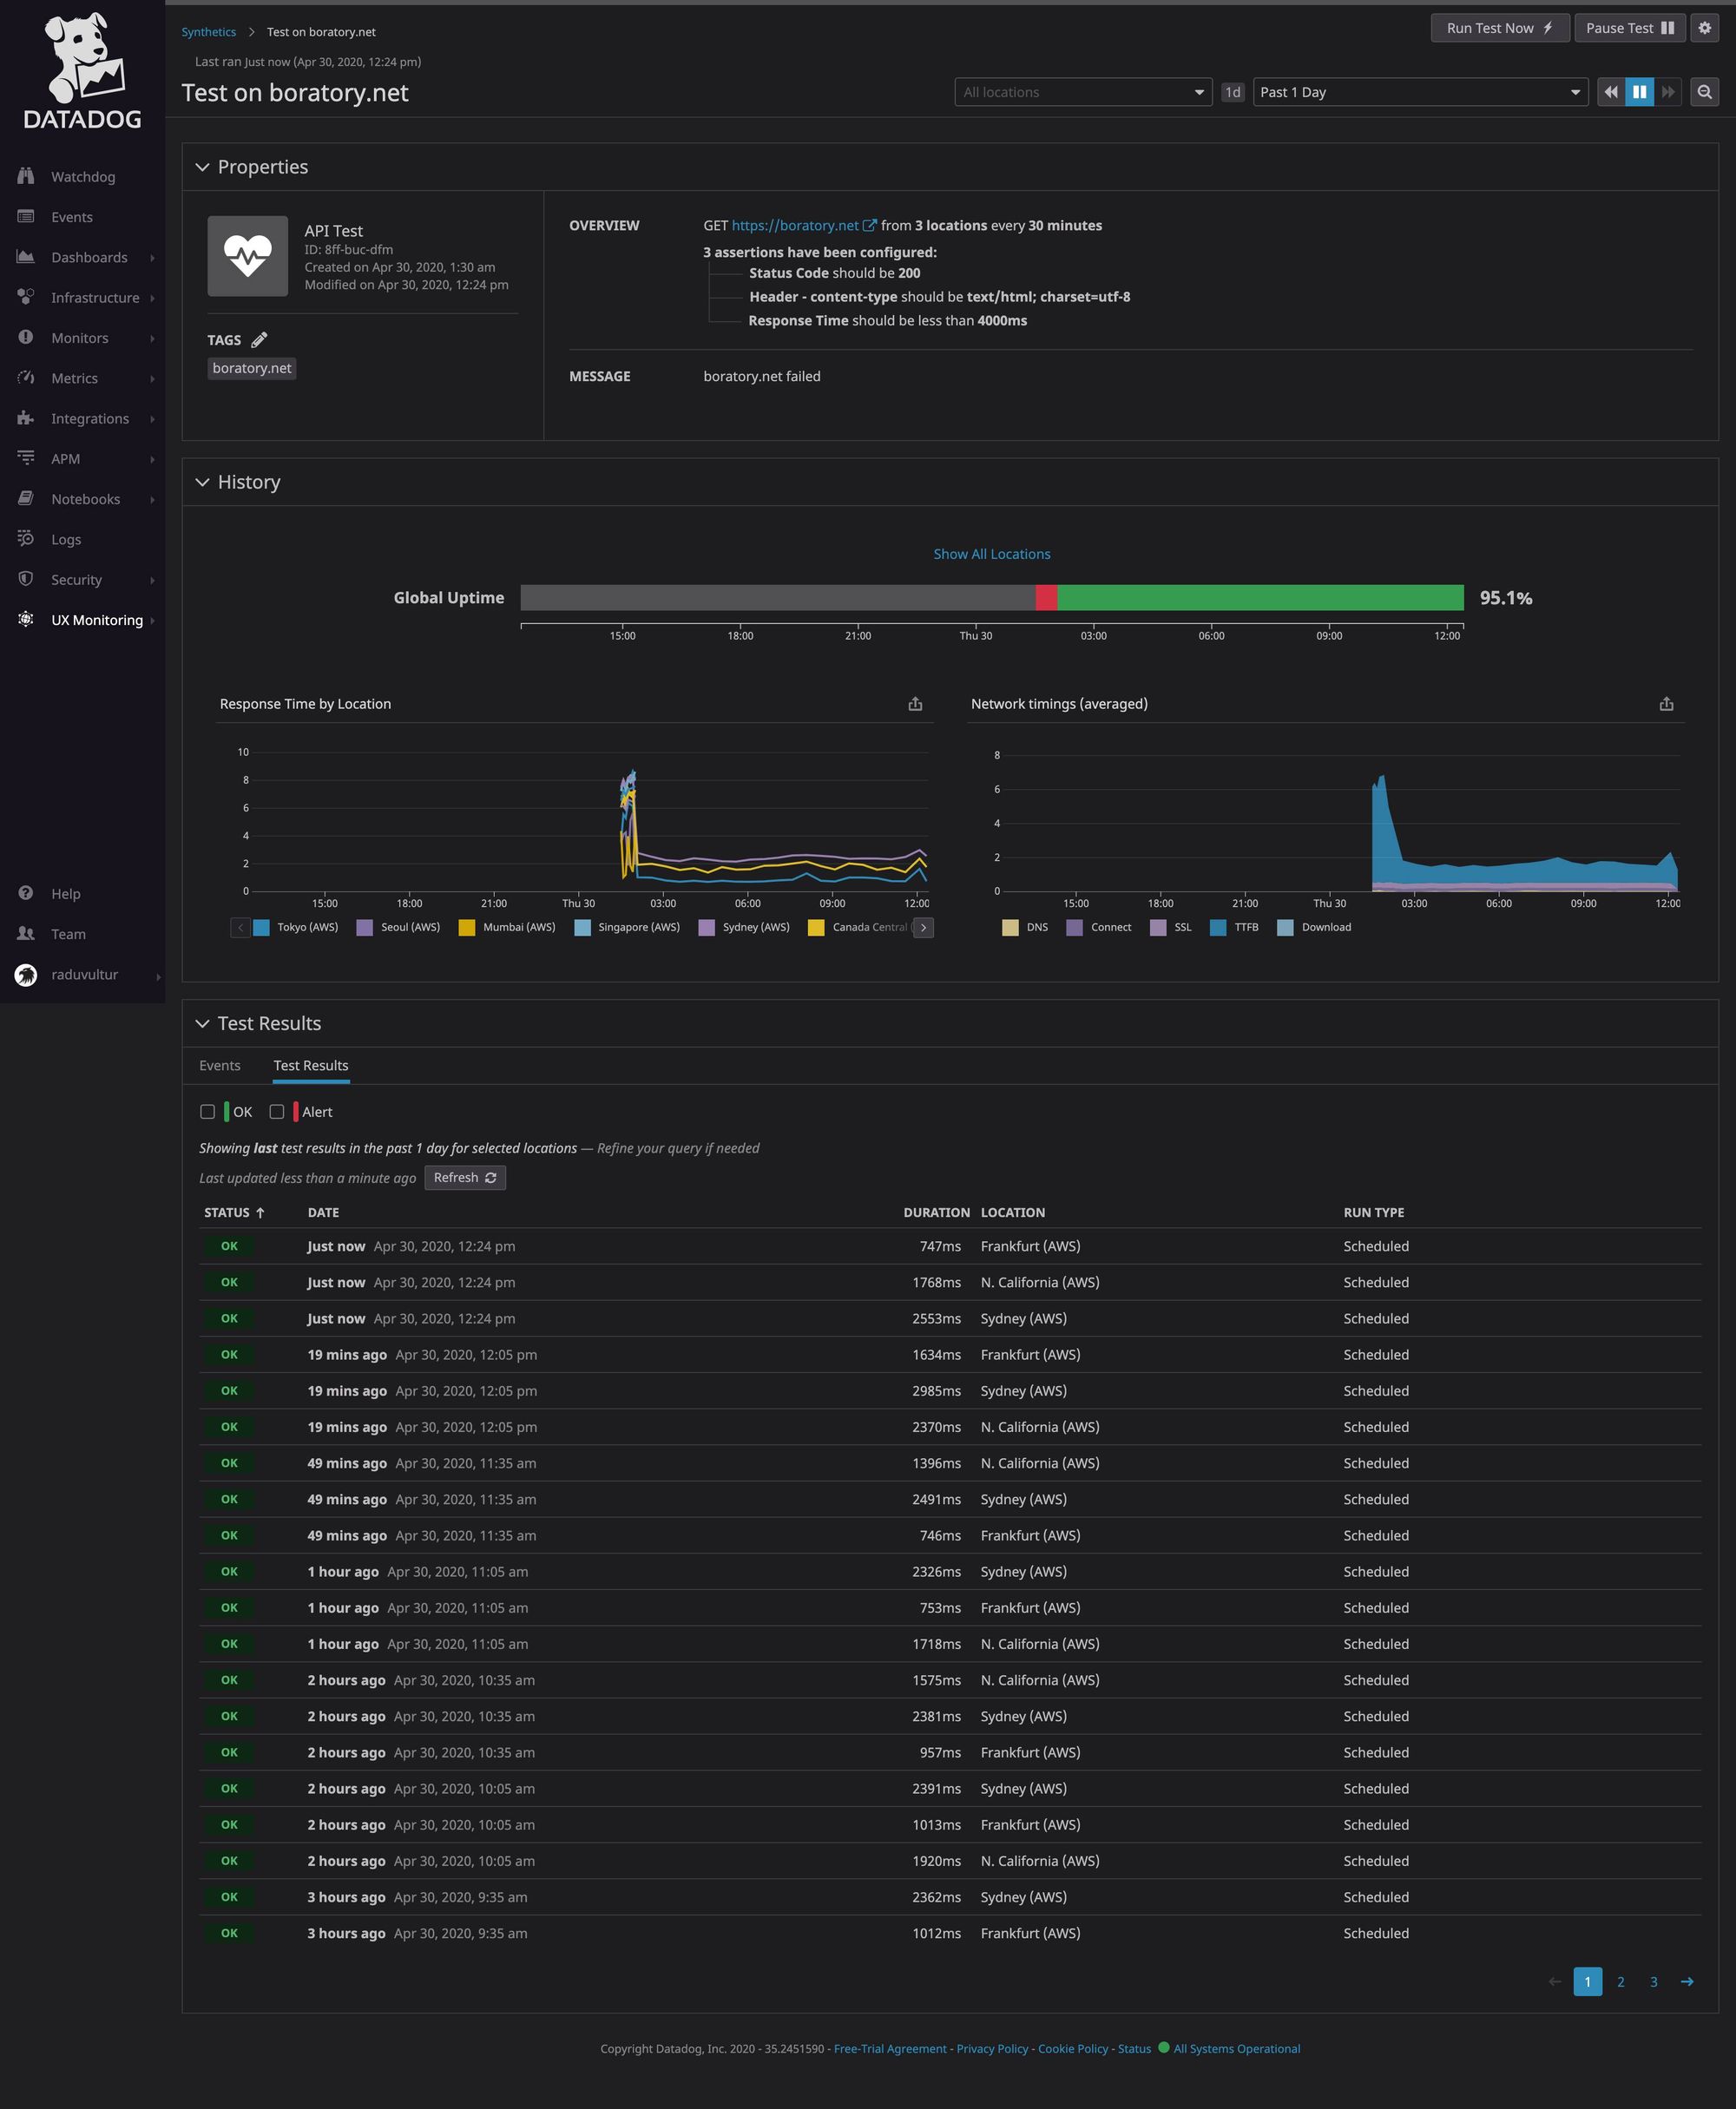
There you go. It's a complete solution, that's free and future proof so I encourage you to spend some time to set this up.
The Other Solution (easy)
So you think that's way too complicated, don't have the time or the need for this level of detail? Worry not, I have something for you:
We call you when your website is down
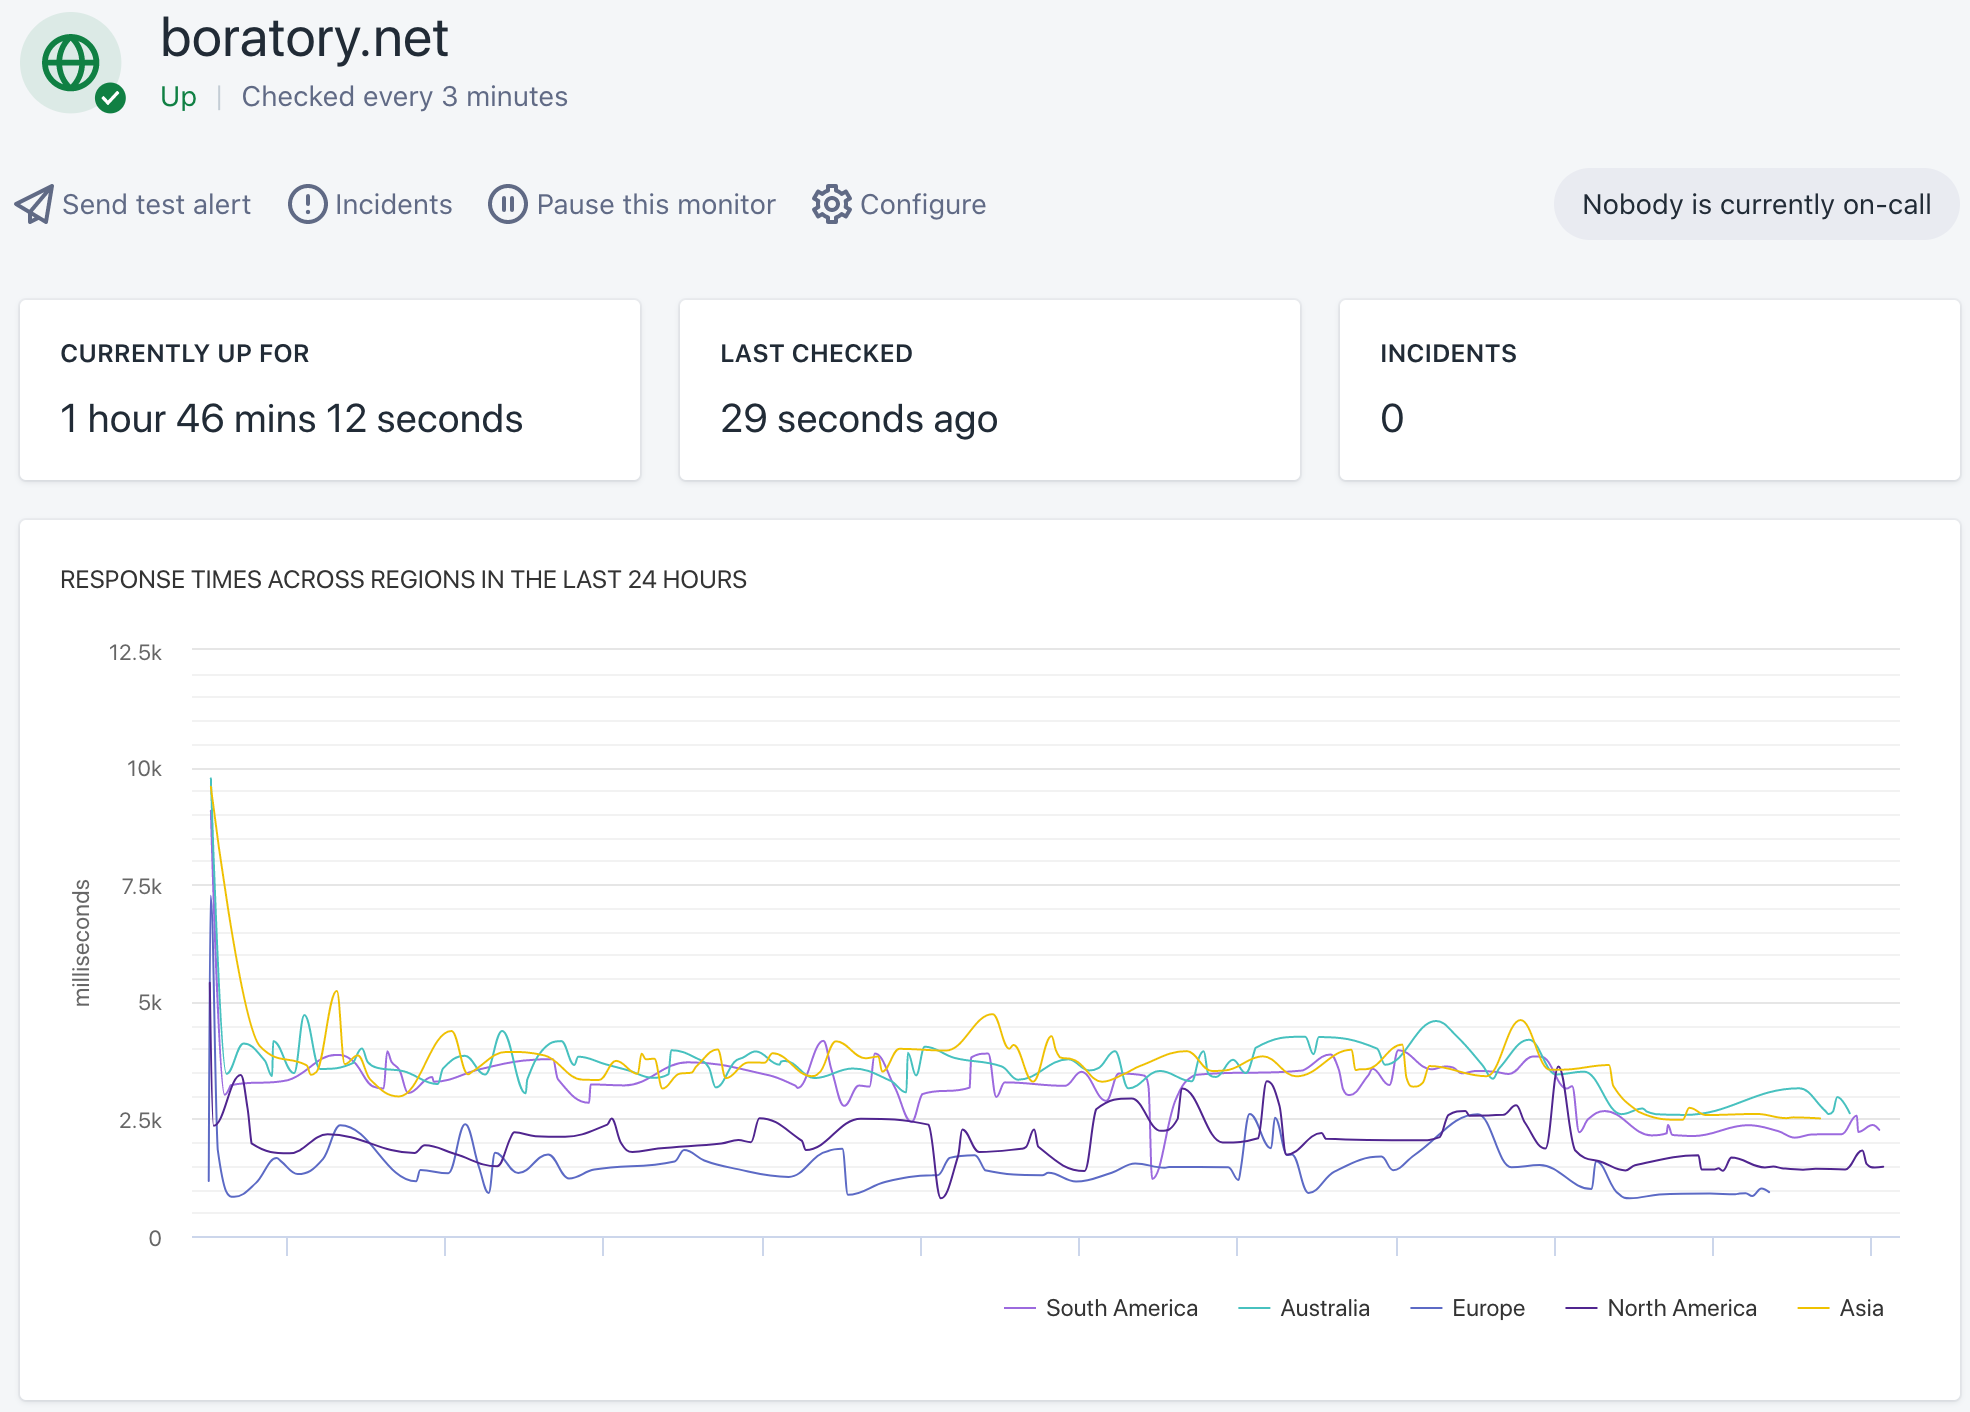
That's betteruptime.com. Simple and easy to set up. It even provides an integration with... Datadog. In a few words, when your site becomes unresponsive they call you, send you an SMS and an email. So you can't say you were not notified.
What's in the free tier?
- free e-mail alerts
- tests are run within a three minutes interval
- unlimited monitors and
- five calls per month (if you include their badge on your website)
Now the choice is yours. Easy or "expert" it's on you. I have both because why not, better safe than sorry, and I don't want you to be unable to read my ramblings.
Drop a comment below if you are using or tested another solution that you think it's worth mentioning. And until next time: keep it up! :)


